Starfleet — Ambient Intelligence Dashboard
The Starfleet dashboard (/starfleet in the Admin UI) brings MoE Sovereign's operational
awareness one level beyond passive metrics: it actively monitors the system, pushes alerts
before problems escalate, and provides a single-pane view of infrastructure health, project
context, and feature configuration.
Navigation: Admin UI → Monitoring → Starfleet
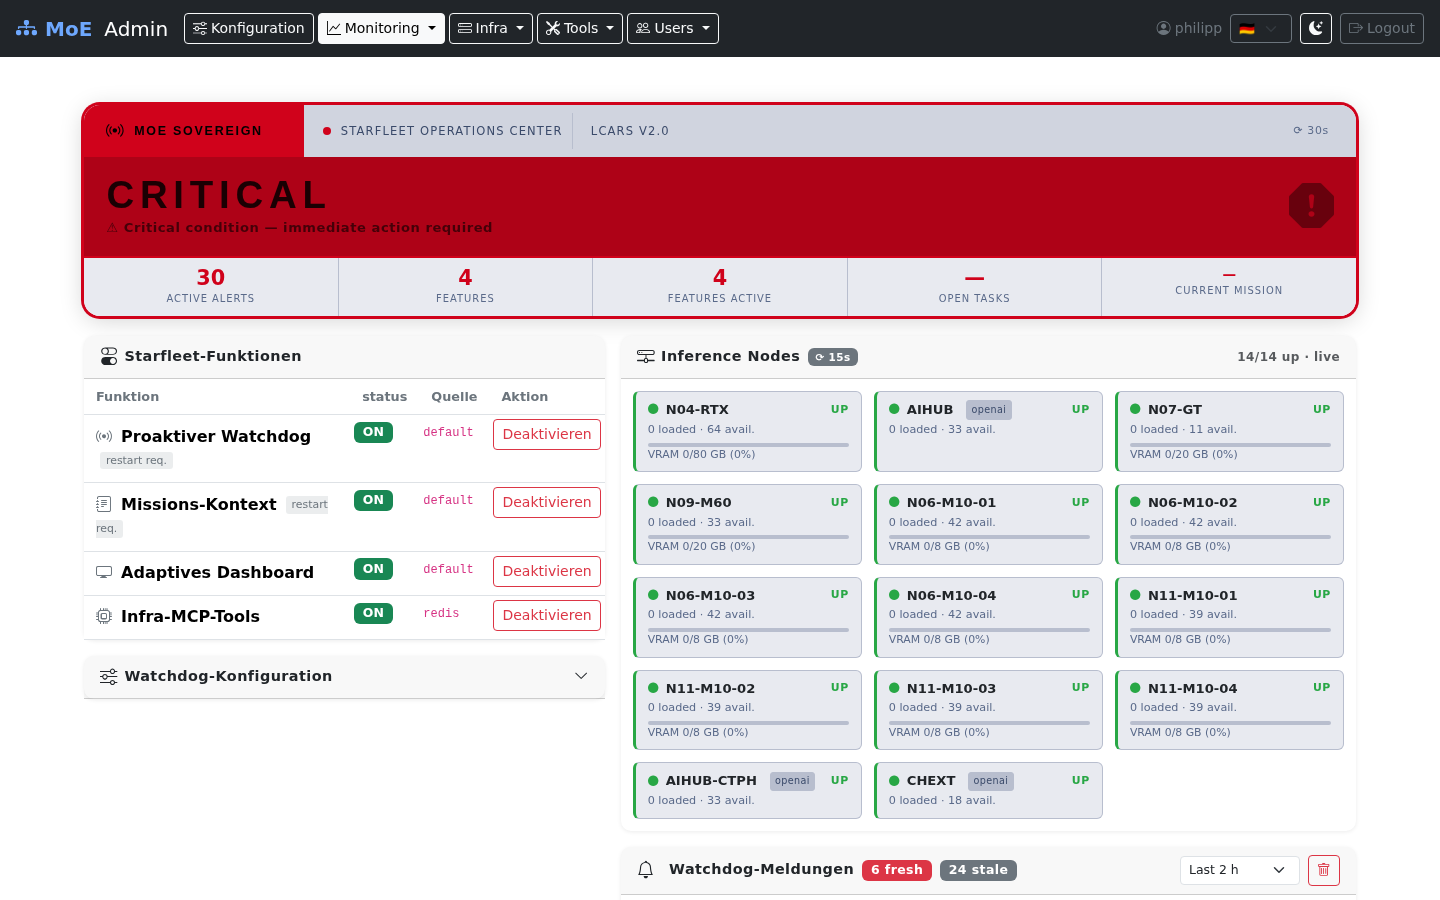
LCARS Status Frame
The top section uses a LCARS-inspired status frame whose colour changes with the current system state:
| State | Colour | Condition |
|---|---|---|
| NOMINAL | Green | No unresolved alerts in the selected time window |
| DEGRADED | Amber | VRAM above threshold or stuck benchmark |
| CRITICAL | Red (pulsing) | One or more nodes unreachable |
| BENCHMARK | Blue | Heavy inference load active for > 2 min |
| UNREACHABLE | Grey | Orchestrator container not responding |
The metrics strip below the banner shows at a glance: active alerts, features enabled, open mission tasks, and the current mission title.
Inference Node Grid (Live)
The Inference Nodes panel performs parallel live health checks every 15 seconds without reloading the page.
- Ollama nodes — checked via
GET /api/tags(model count) +/api/ps(VRAM usage) - OpenAI-compatible endpoints — checked via
GET /modelswith Bearer token auth - Three states: UP (green), DOWN (red), UNKNOWN (grey — endpoint without token)
- VRAM bar shows current utilisation with colour thresholds: amber ≥ 75 %, red ≥ 90 %
- Results are cached in Valkey for 20 s — rapid refreshes never hammer the nodes
Example: After N06-M10-01 loads a 7B model, its VRAM bar immediately reflects
4.2 / 8 GB (52 %) on the next 15 s poll without any manual refresh.
Proactive Watchdog
The Watchdog runs as a background loop in the orchestrator container, evaluating thresholds every 60 seconds using Prometheus gauges that are already collected by the existing gauge loop — zero additional HTTP calls to inference nodes.
Alert types
| Alert | Severity | Fires when |
|---|---|---|
NODE_DOWN |
Critical | Node unreachable for ≥ N consecutive cycles (configurable, default 2 = 120 s) |
NODE_RECOVERED |
Info | Node back online after a NODE_DOWN state |
VRAM_HIGH |
Warning | VRAM usage ≥ threshold (default 90 %) on a node |
BENCHMARK_STUCK |
Warning | Active request count frozen for ≥ 30 min |
False-positive avoidance:
- 2-cycle grace period after container restart (gauges default to 0 before first poll)
- Stale alerts (older than the selected time window) are shown at 45 % opacity and do not influence the LCARS system state
NO_MODELS_LOADEDis intentionally omitted — idle VRAM is Ollama's normal state
Alert list controls
- Time filter — dropdown: Last 30 min / 2 h / 8 h / 24 h / All
- 🗑 Clear — deletes all stored alerts immediately (requires confirmation)
- Alerts are persisted in Valkey (
moe:watchdog:alerts, max 100 entries LIFO)
Email Escalation
When configured, the watchdog sends HTML emails for alerts matching the configured severity levels, with per-alert cooldown to prevent notification storms.
Example workflow:
- N09-M60 becomes unreachable at 03:14.
- After 2 cycles (120 s), a
NODE_DOWN / criticalalert fires. - An email is sent to
ops@example.orgwith a colour-coded HTML body. - The cooldown key
moe:watchdog:cooldown:node_down:N09-M60is set in Valkey with a 30-minute TTL. - No further email is sent for this node/alert-type until the TTL expires — even if the alert fires again every 60 s.
- When the node recovers, a
NODE_RECOVERED / infoemail fires (if info is in the configured severity list).
Configuring email escalation
Open the Watchdog-Konfiguration panel on the Starfleet page and fill in:
| Field | Description |
|---|---|
| Escalation email | Recipient address (single address or distribution list) |
| Cooldown (min) | Minimum gap between two mails for the same alert type / node |
| Escalate severities | Multi-select: Info / Warning / Critical |
| Test-Mail senden | Sends a test email immediately to verify SMTP settings |
All threshold changes are hot-reload — they take effect on the next 60 s watchdog cycle without restarting any container.
Mission Context
Mission Context is a cross-session project state document stored at
$MOE_DATA_ROOT/mission_context.json.
It contains: - Project title and description - Open tasks (checklist items currently in flight) - Recent decisions (timestamped log) - Active nodes (which inference nodes are relevant to this mission) - Tags
Why it matters
Without Mission Context, every conversation starts from zero. With it, experts receive a compact project summary as a system-prompt preamble, giving them immediate awareness of what is being built, what has already been decided, and what is still open.
Example:
## Mission Context: Star Trek Feature Sprint
Open tasks: Test watchdog; Verify LCARS theme; Update docs
Last decision: NOMINAL = green, not amber (2026-04-30)
This preamble is injected before the expert's own system prompt, so the expert knows the project context before processing the user's query.
Enabling per template
Mission Context injection is opt-in per expert template:
- Open Admin UI → Tools → Expert Templates
- Edit a template → Pipeline Toggles → enable Mission Context
- Save
The system-wide feature switch (Starfleet → Starfleet-Funktionen → Missions-Kontext) must also be enabled. If the system switch is off, no template can use it regardless of its own setting.
API
GET  /api/mission-context          # read current context
POST /api/mission-context          # replace context
PATCH /api/mission-context         # merge-update individual fields
Feature Toggles
The Starfleet-Funktionen panel controls all four ambient intelligence features:
| Feature | Default | Requires restart | Description |
|---|---|---|---|
| Proaktiver Watchdog | ON | Yes | Background alert loop |
| Missions-Kontext | ON | Yes | Cross-session project state |
| Adaptives Dashboard | ON | No | LCARS UI enabled |
| Infra-MCP-Tools | OFF | Yes | Read-only MCP tools for self-introspection |
Two-layer toggle system:
.envflag (e.g.WATCHDOG_ENABLED=true) — persists across restarts- Redis key
moe:features:<name>— runtime override, takes effect immediately, survives until explicitly cleared or the Redis instance is flushed
# Disable watchdog at runtime without restart
redis-cli SET moe:features:watchdog false

# Re-enable
redis-cli SET moe:features:watchdog true
Infra MCP Tools
When INFRA_MCP_ENABLED=true, four read-only MCP tools become available to the
orchestrator's AI pipeline:
| Tool | Returns |
|---|---|
node_status |
Live health, VRAM, loaded models per node |
active_requests |
Count of in-flight LLM requests |
mission_context_get |
Current mission context document |
watchdog_alerts |
Recent alert history |
Example use case: An agentic coding session can call node_status() before
dispatching a large batch job to confirm that the target inference node has sufficient
free VRAM — without the user having to check the dashboard manually.
Configuration Reference
All Starfleet settings live in the STARFLEET FEATURES section of .env:
WATCHDOG_ENABLED=true
WATCHDOG_DOWN_THRESHOLD=2        # cycles before NODE_DOWN fires
WATCHDOG_INTERVAL_SECONDS=60     # evaluation cadence
WATCHDOG_VRAM_THRESHOLD=0.90     # 90% VRAM triggers VRAM_HIGH
MISSION_CONTEXT_ENABLED=true
ADAPTIVE_UI_ENABLED=true
INFRA_MCP_ENABLED=false
Thresholds can also be changed live via the Watchdog-Konfiguration panel or directly: