UI Screenshots
Screenshots of all MoE Sovereign web interfaces. Generated automatically via Playwright.
Admin UI
All screenshots use the current grouped navigation bar (Konfiguration · Monitoring · Infra · Tools · Users).
Login

Dashboard — Server Status
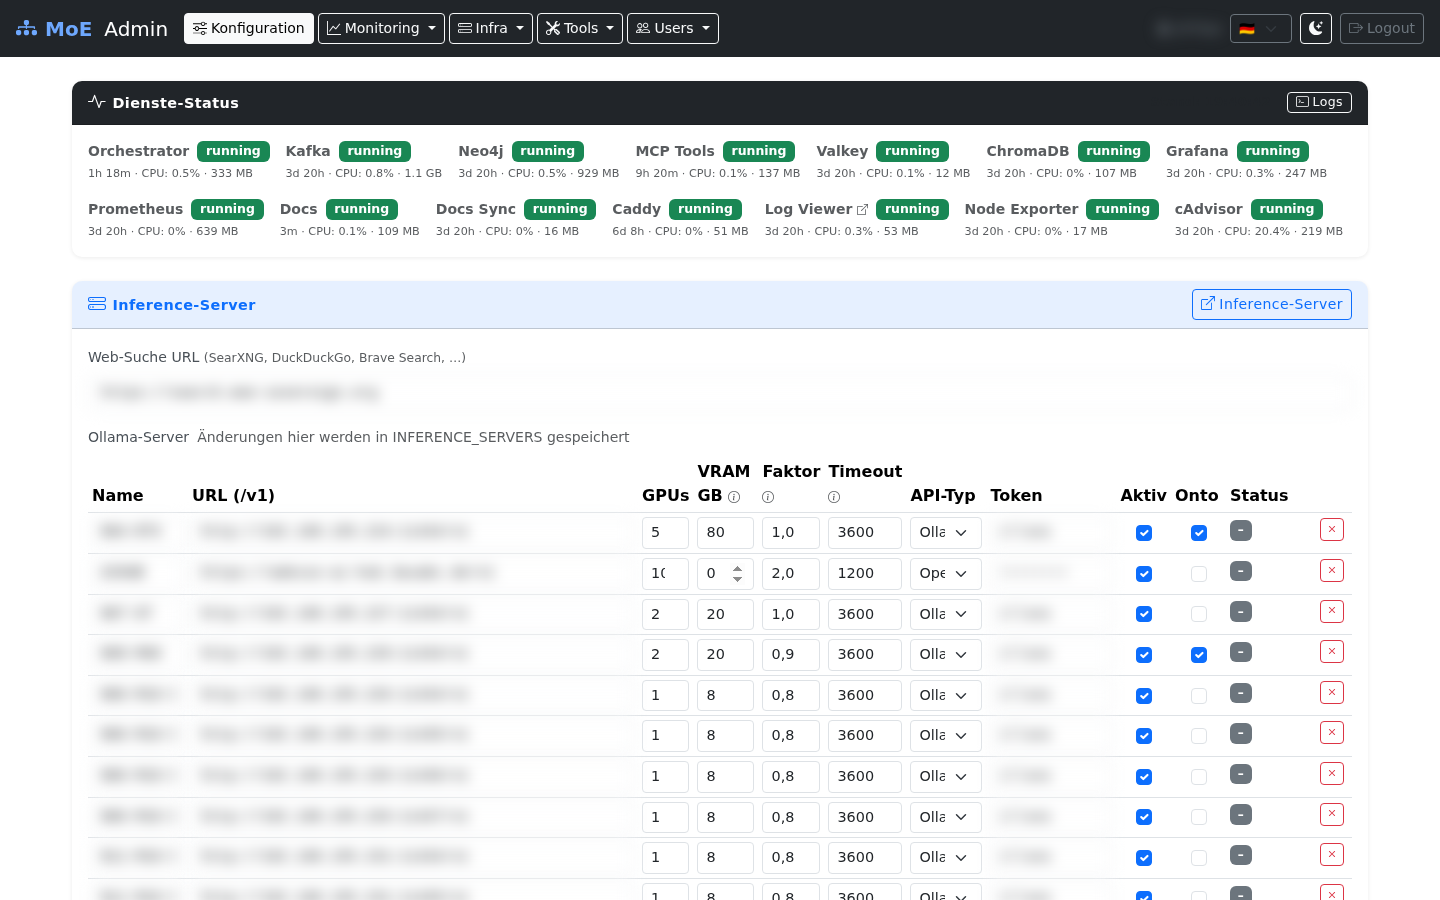
Live inference-node status table with URL, VRAM, GPU count, API type, token and activity indicators.
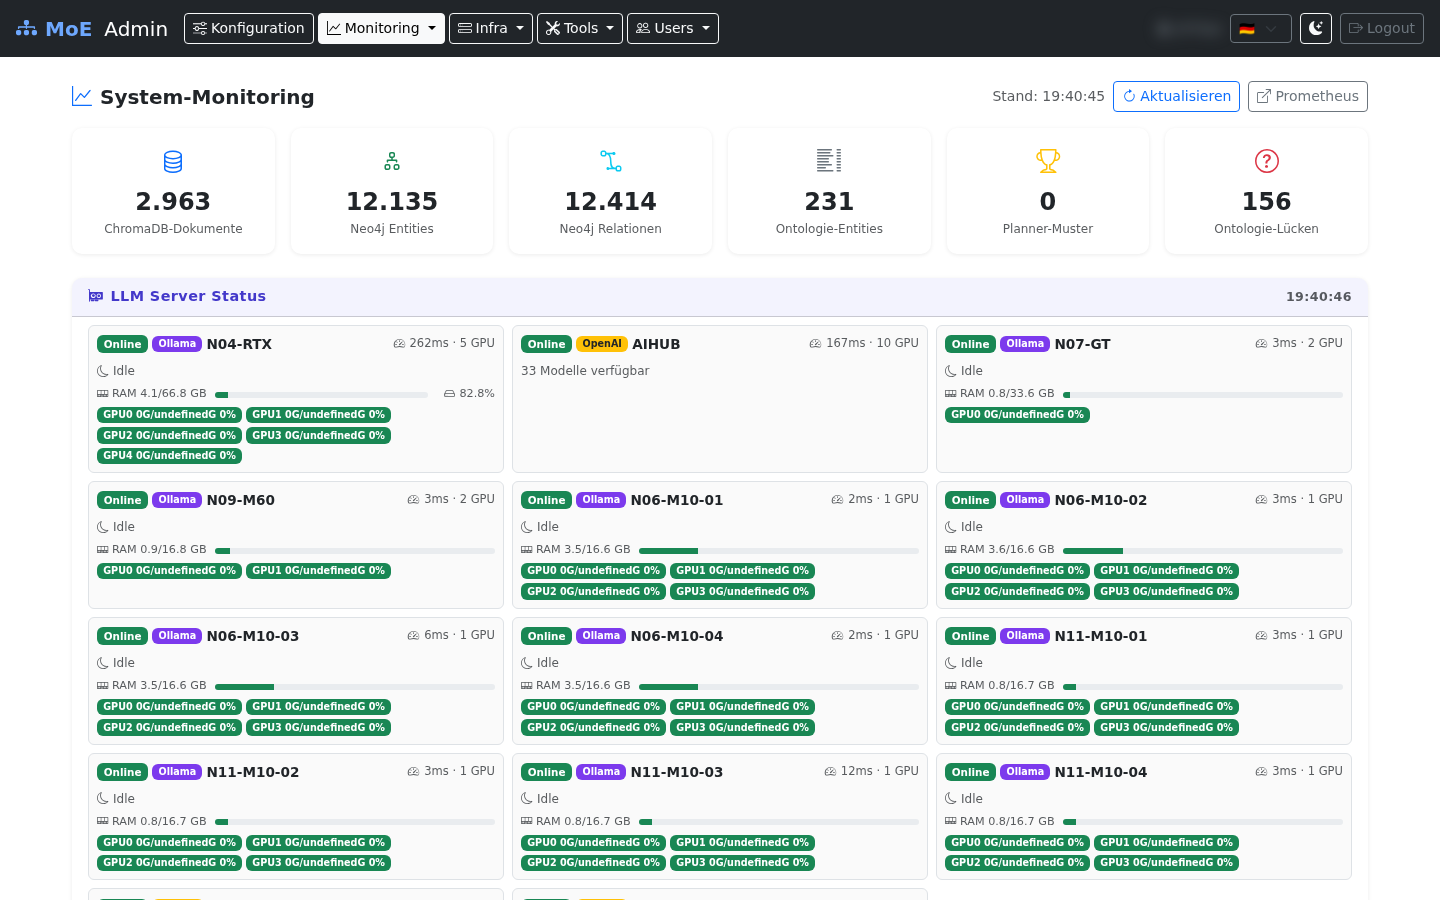
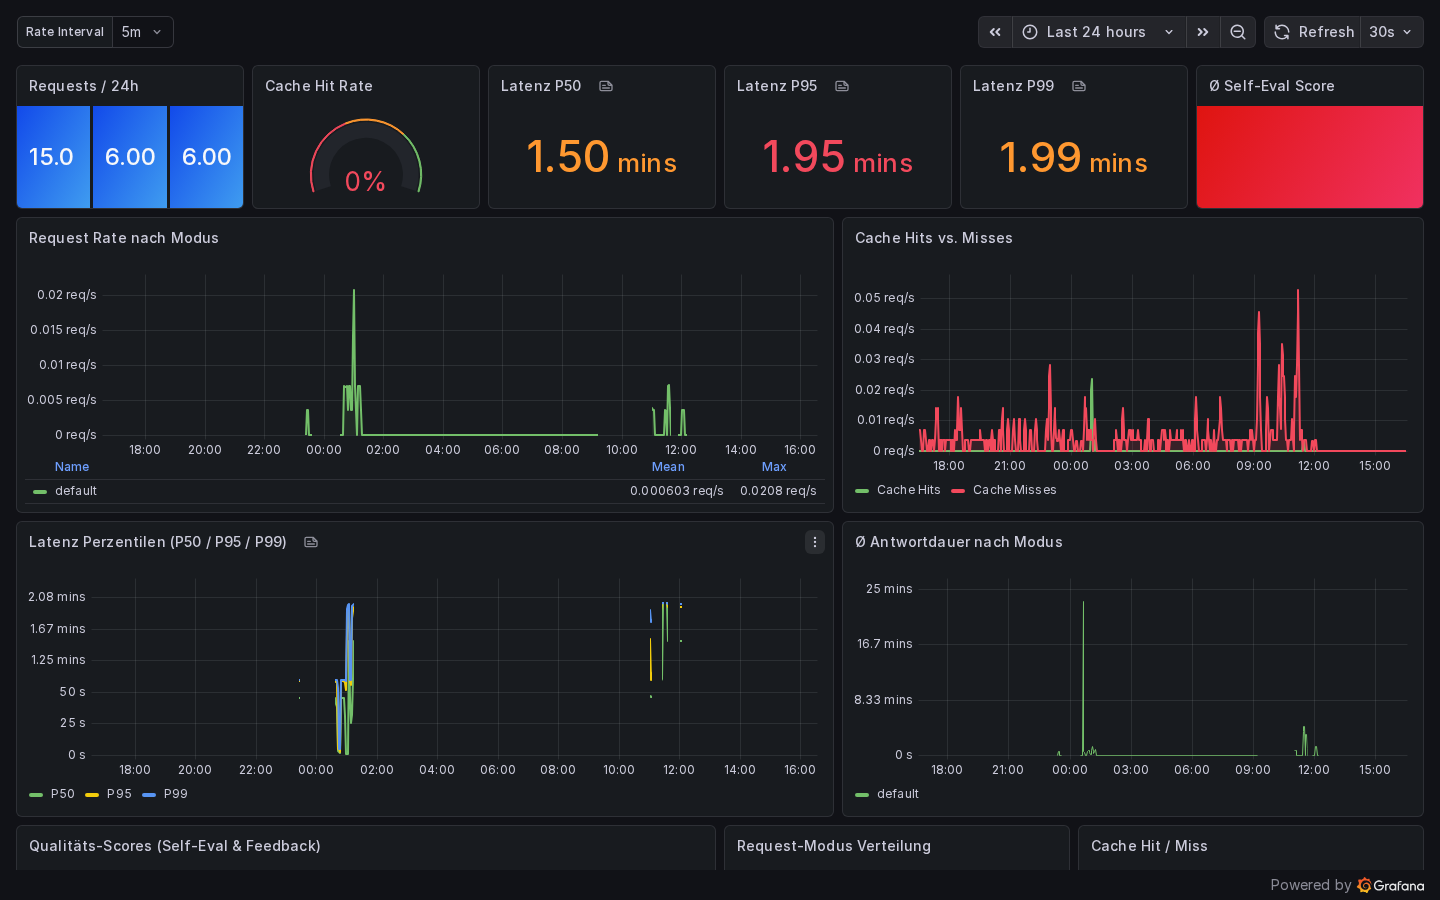
System Monitoring
Six knowledge-stack gauges, LLM server status cards for all inference nodes, and Chart.js widgets for token usage, cache hit rate, expert calls, and latency percentiles.
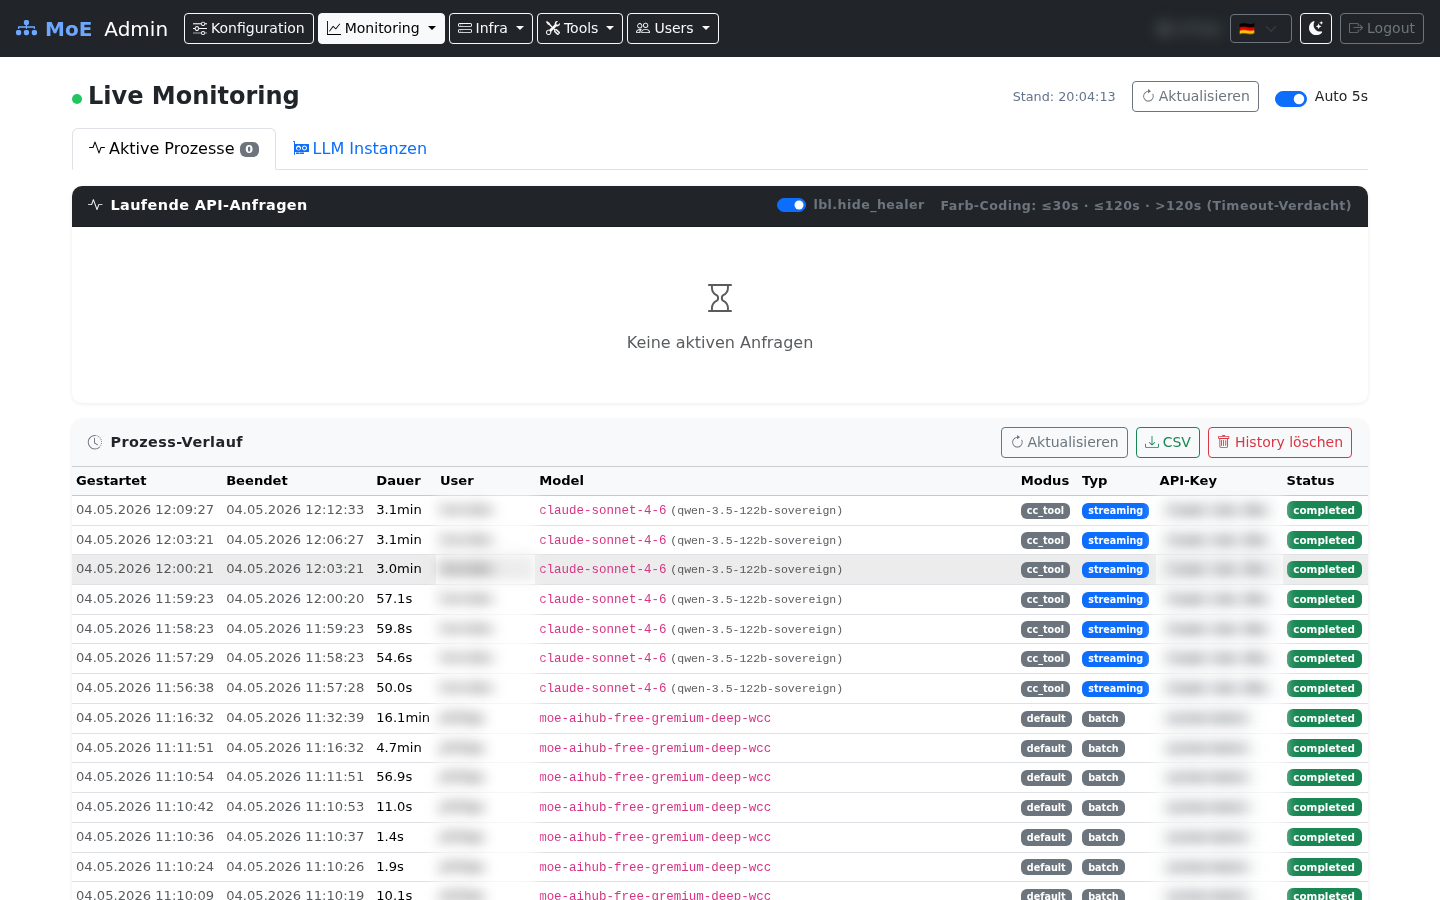
Live Monitoring — Active Processes
Real-time request table (5 s auto-refresh). User and IP columns are privacy-blurred.
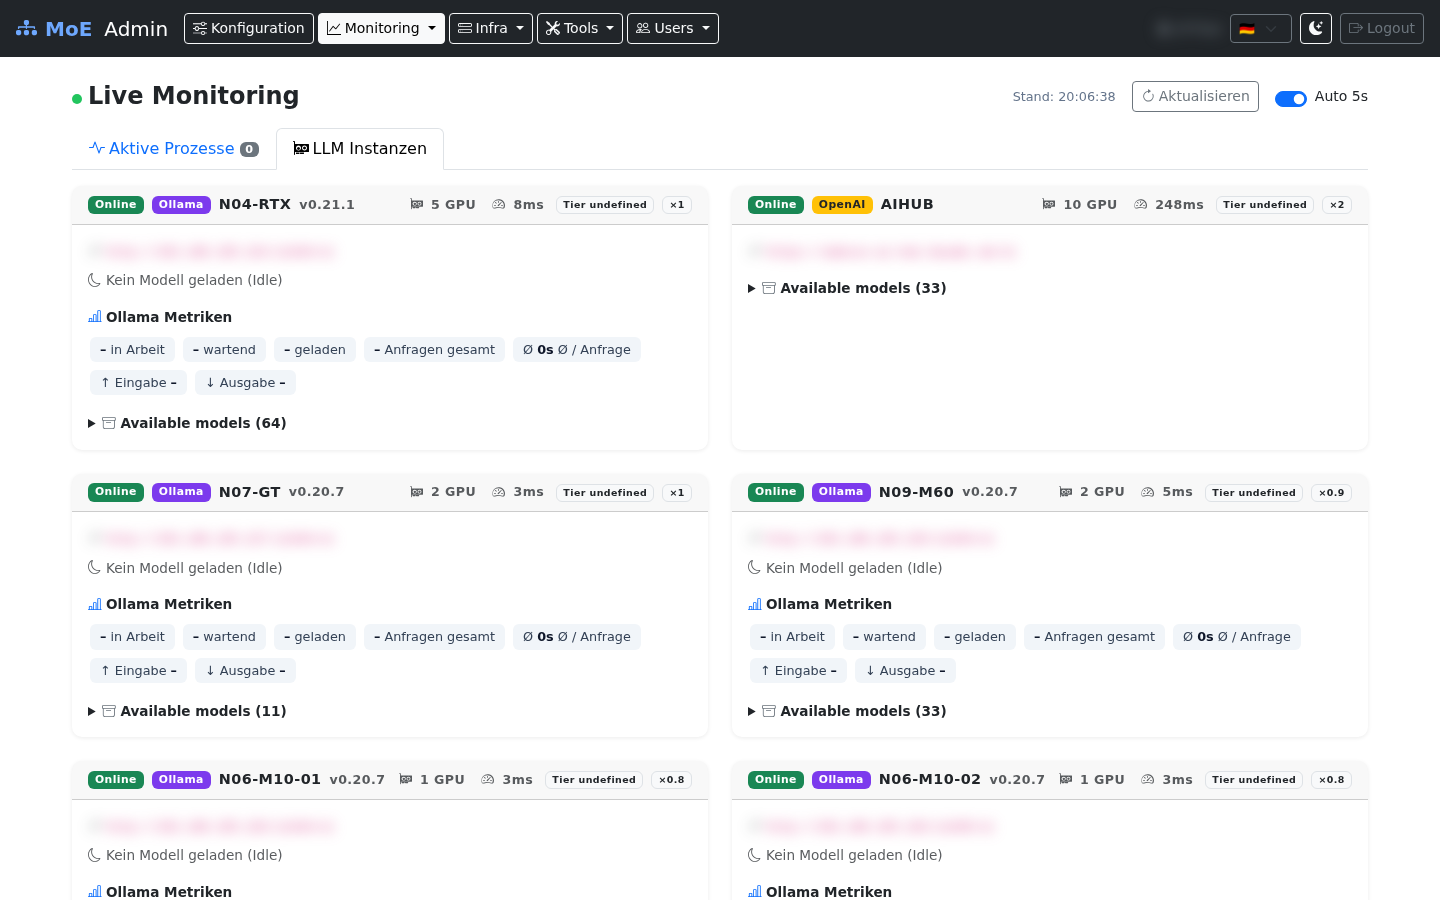
Live Monitoring — LLM Instances
Per-node cards with loaded models, VRAM allocation, Ollama metrics, and the expandable model list.
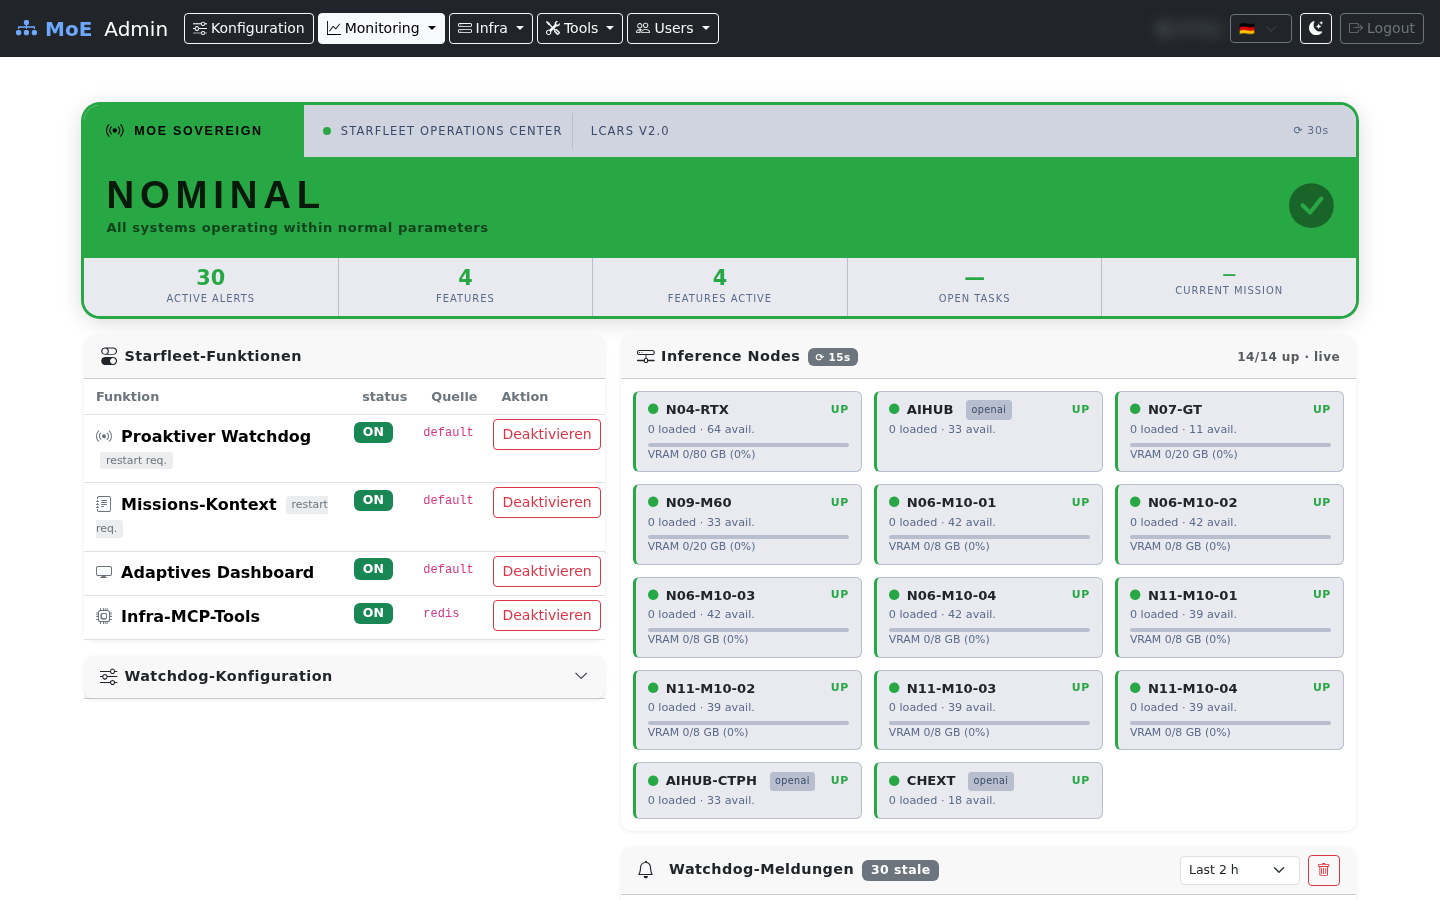
Starfleet — Ambient Intelligence Dashboard
LCARS-style dashboard with live node grid, active alert counters, Starfleet feature toggles, and Watchdog alert feed.
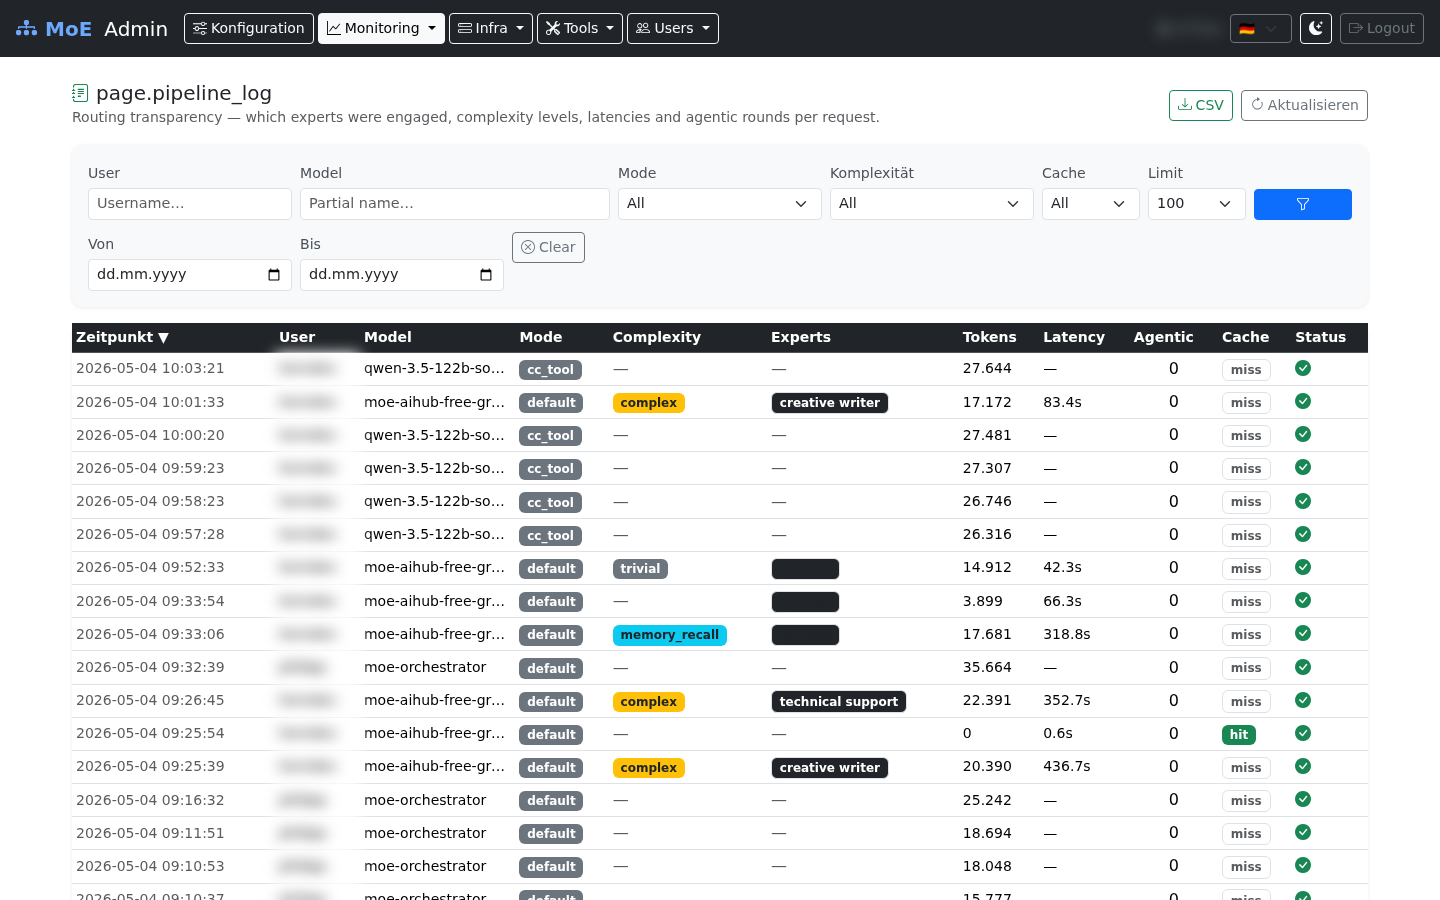
Pipeline Transparency Log
Per-request routing metadata with User / Model / Mode / Complexity / Expert-Domain badges. Filterable, sortable, CSV-exportable. Data blurred for privacy.
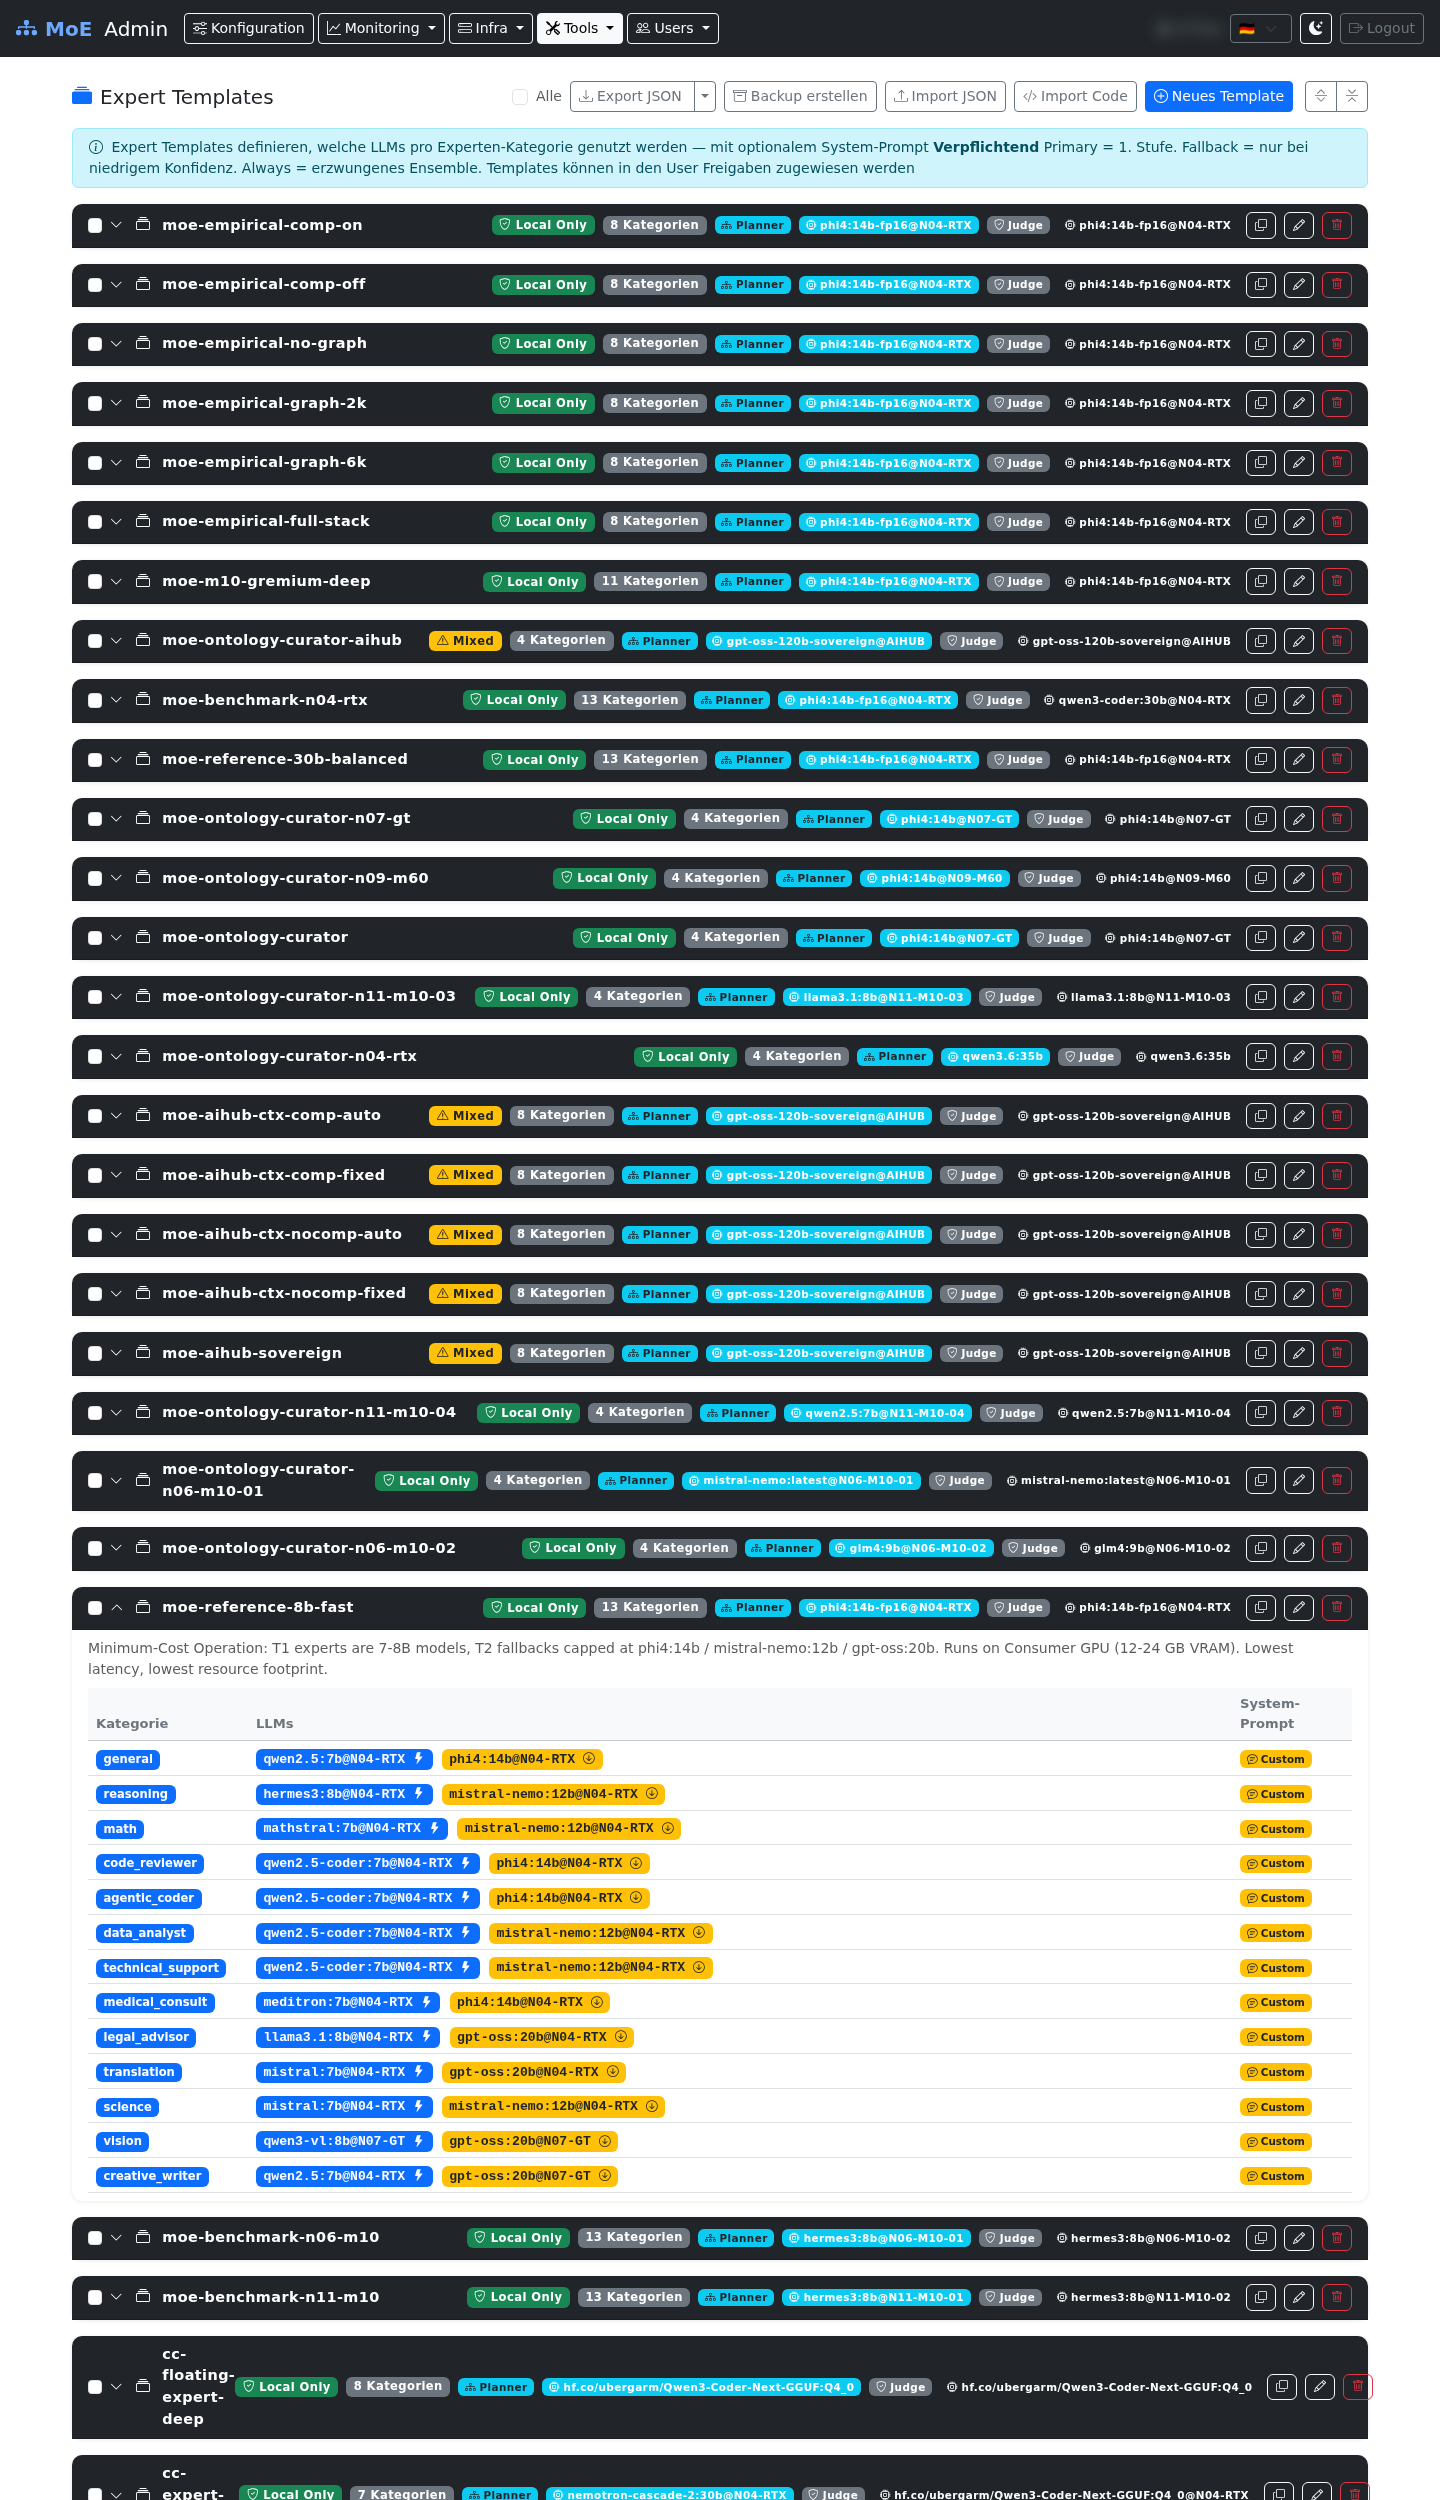
Expert Templates
Claude Code Profiles

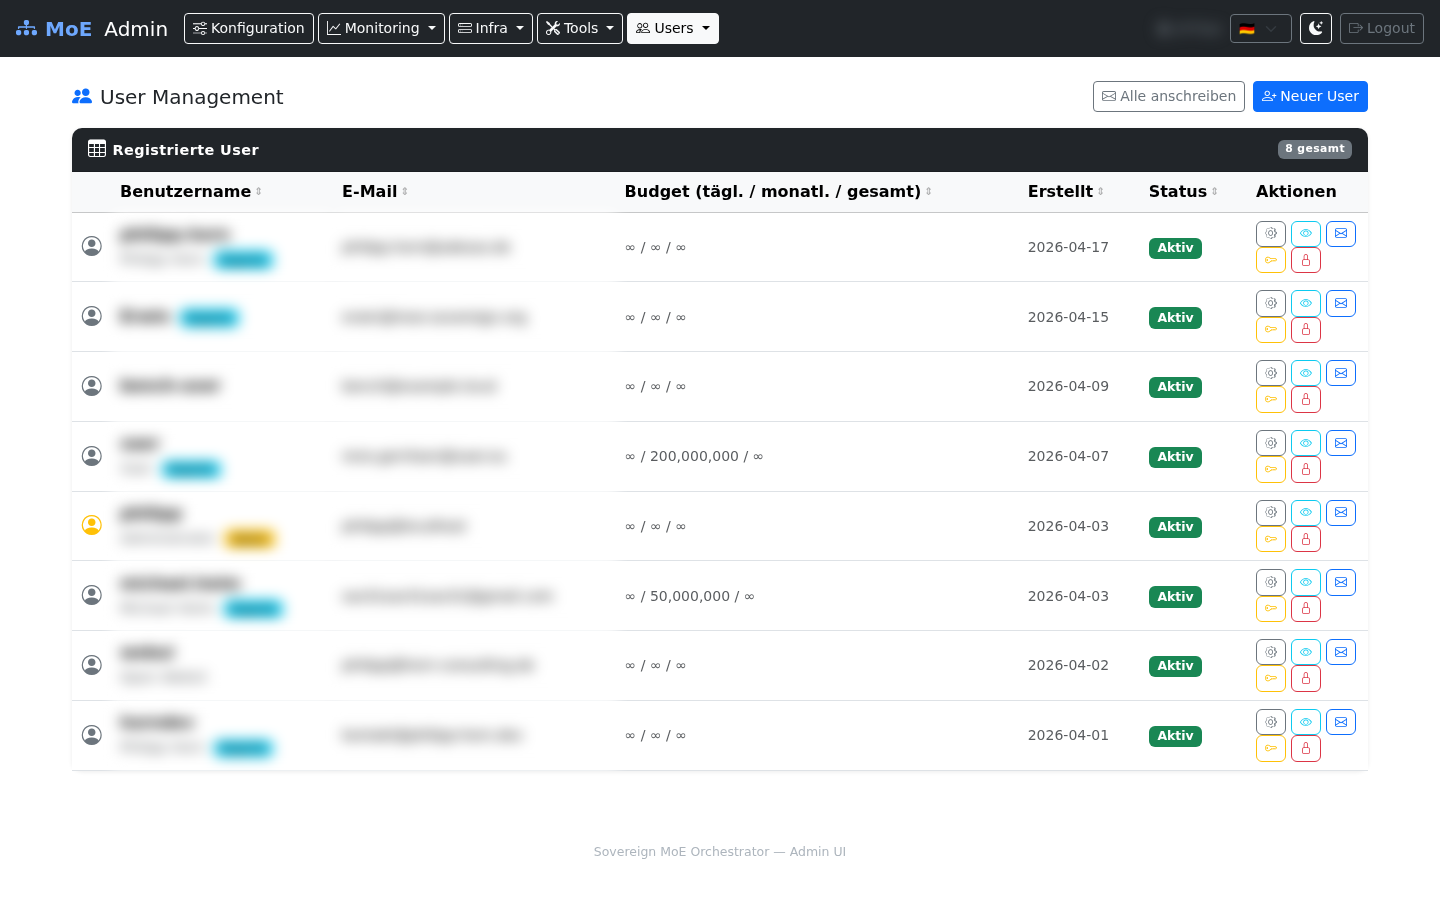
Users & Roles
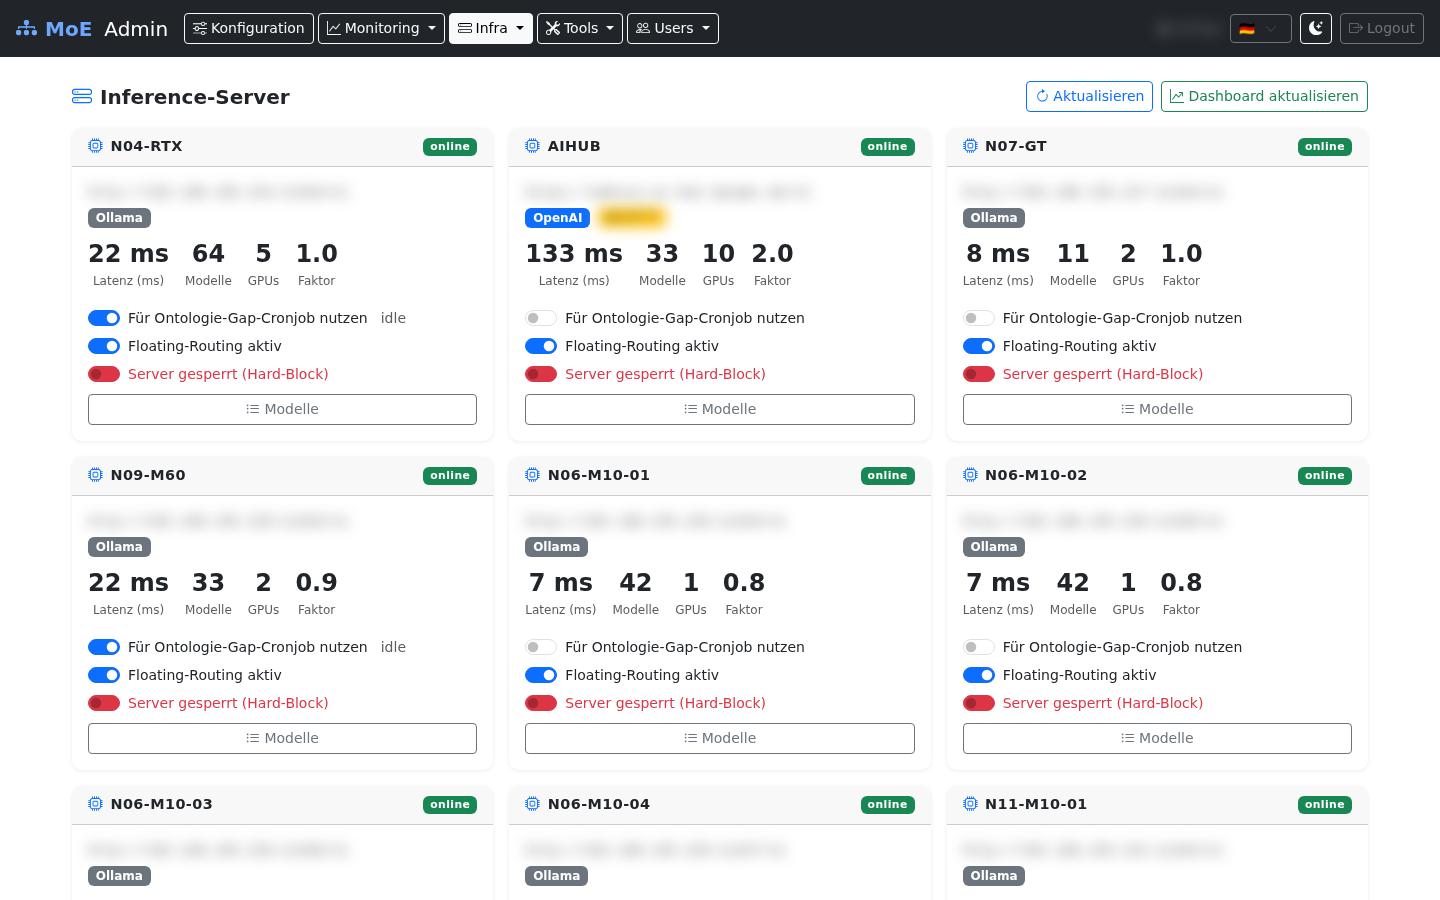
Inference Servers
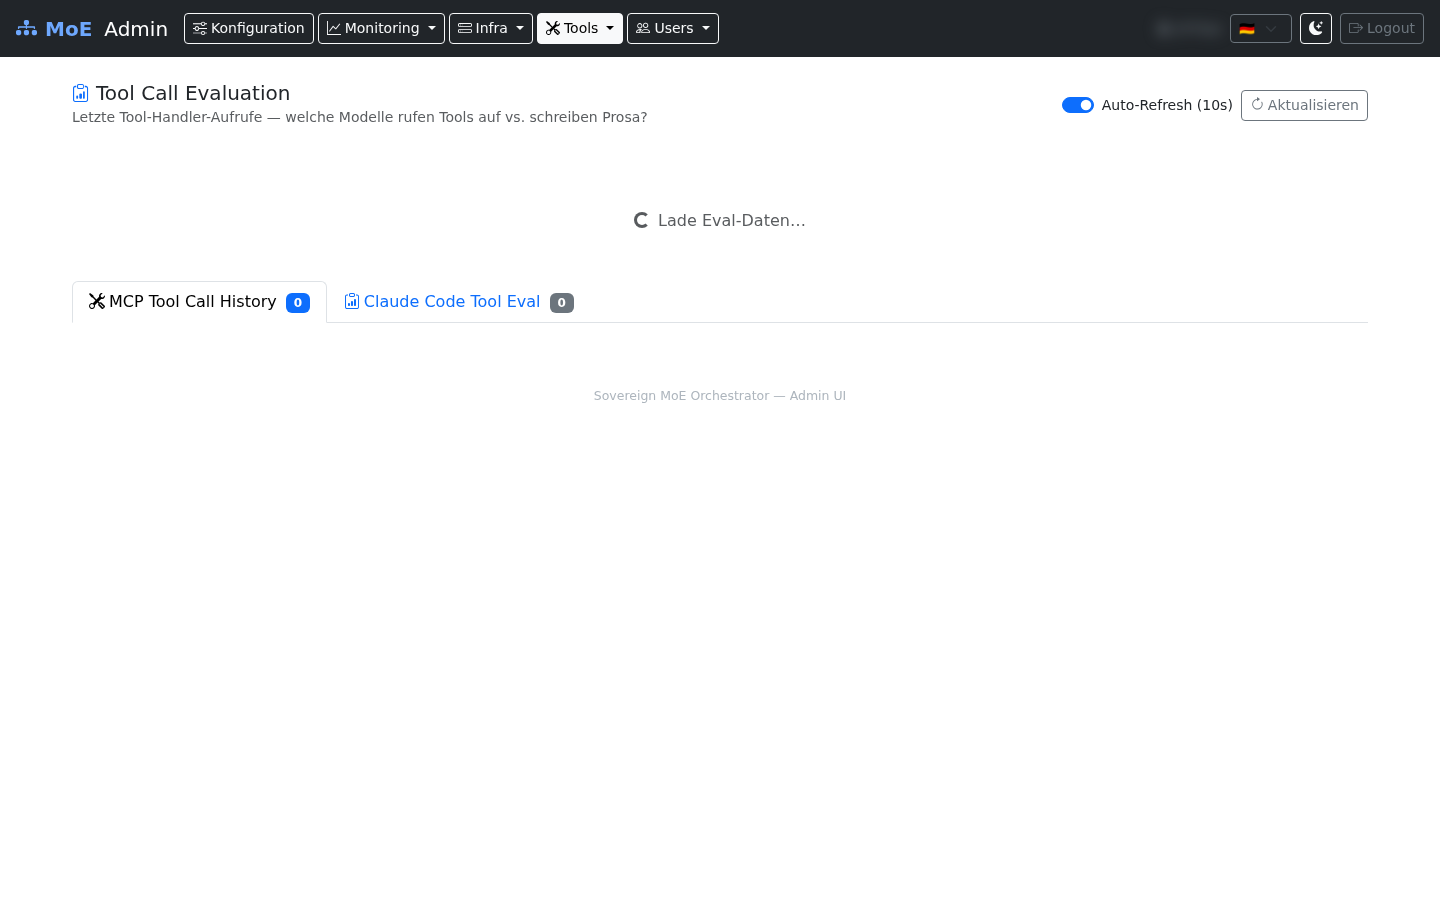
Tool Evaluation Log
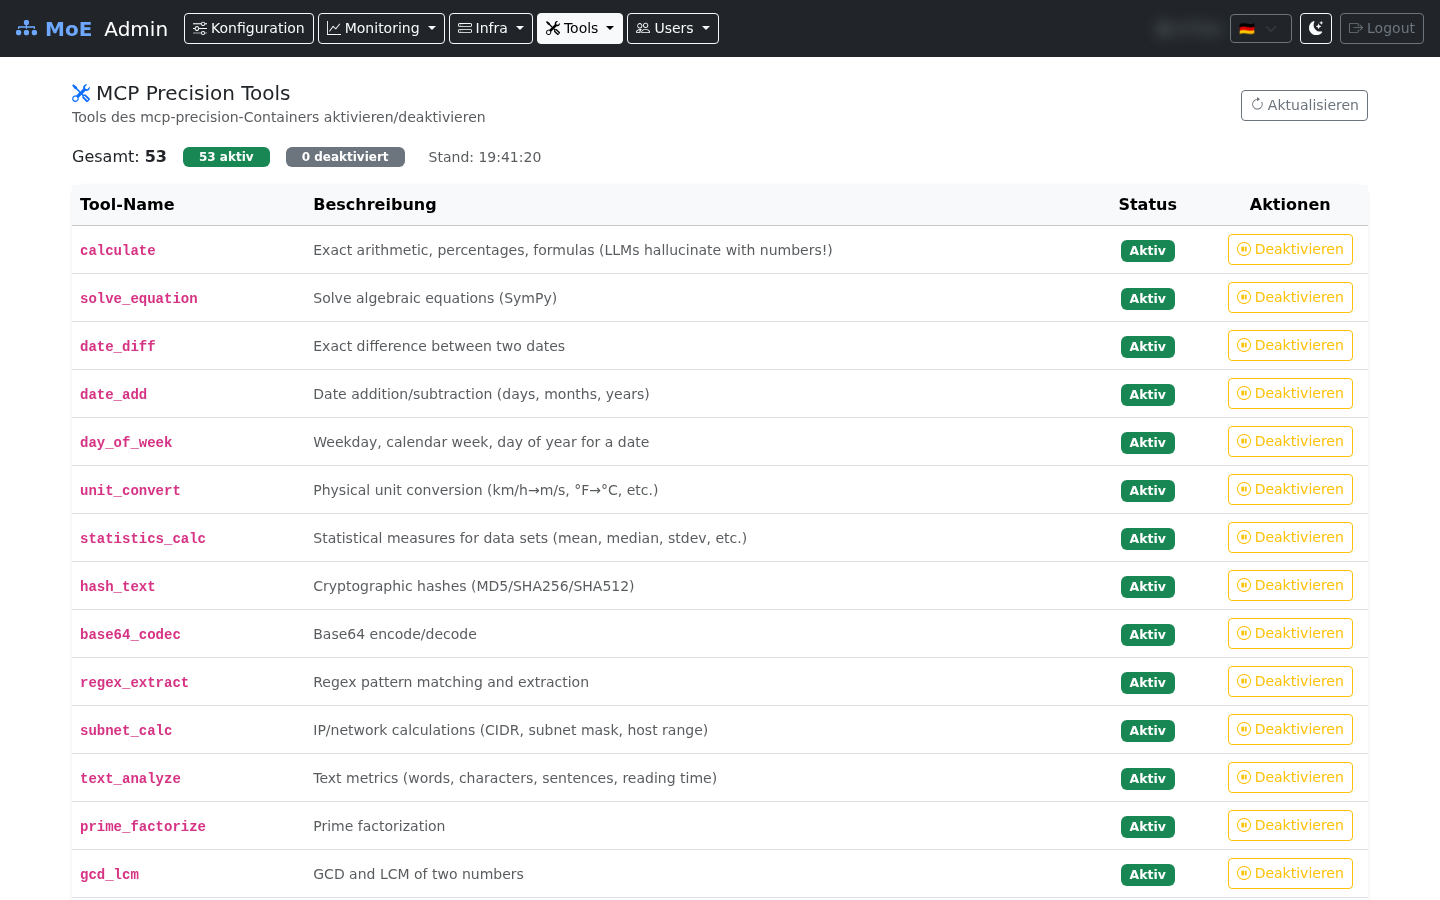
MCP Precision Tools
Skills

Grafana Dashboards
MoE System Overview
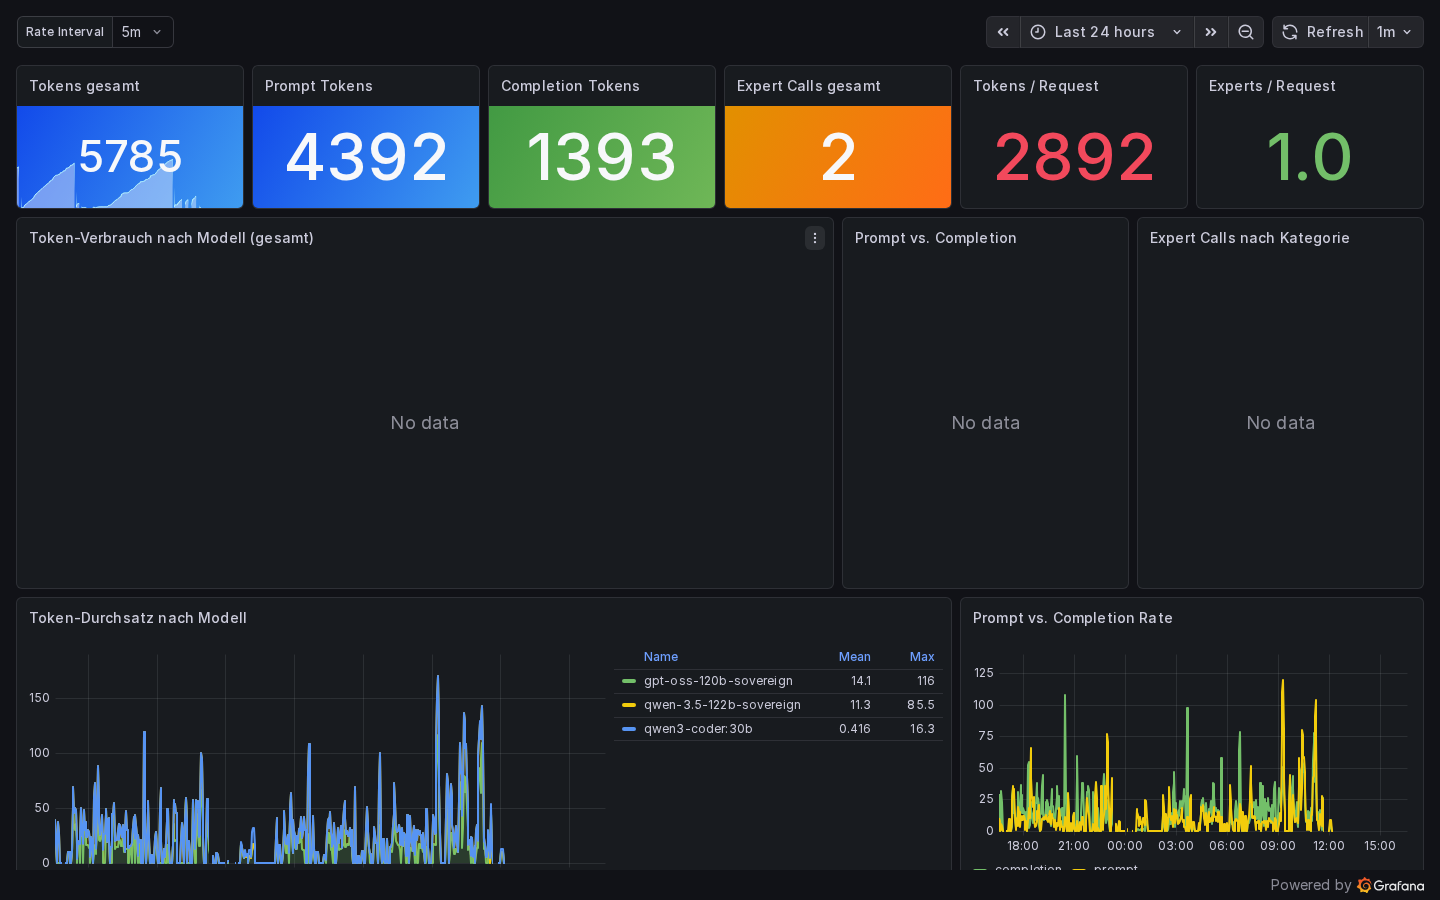
LLM & Expert Usage
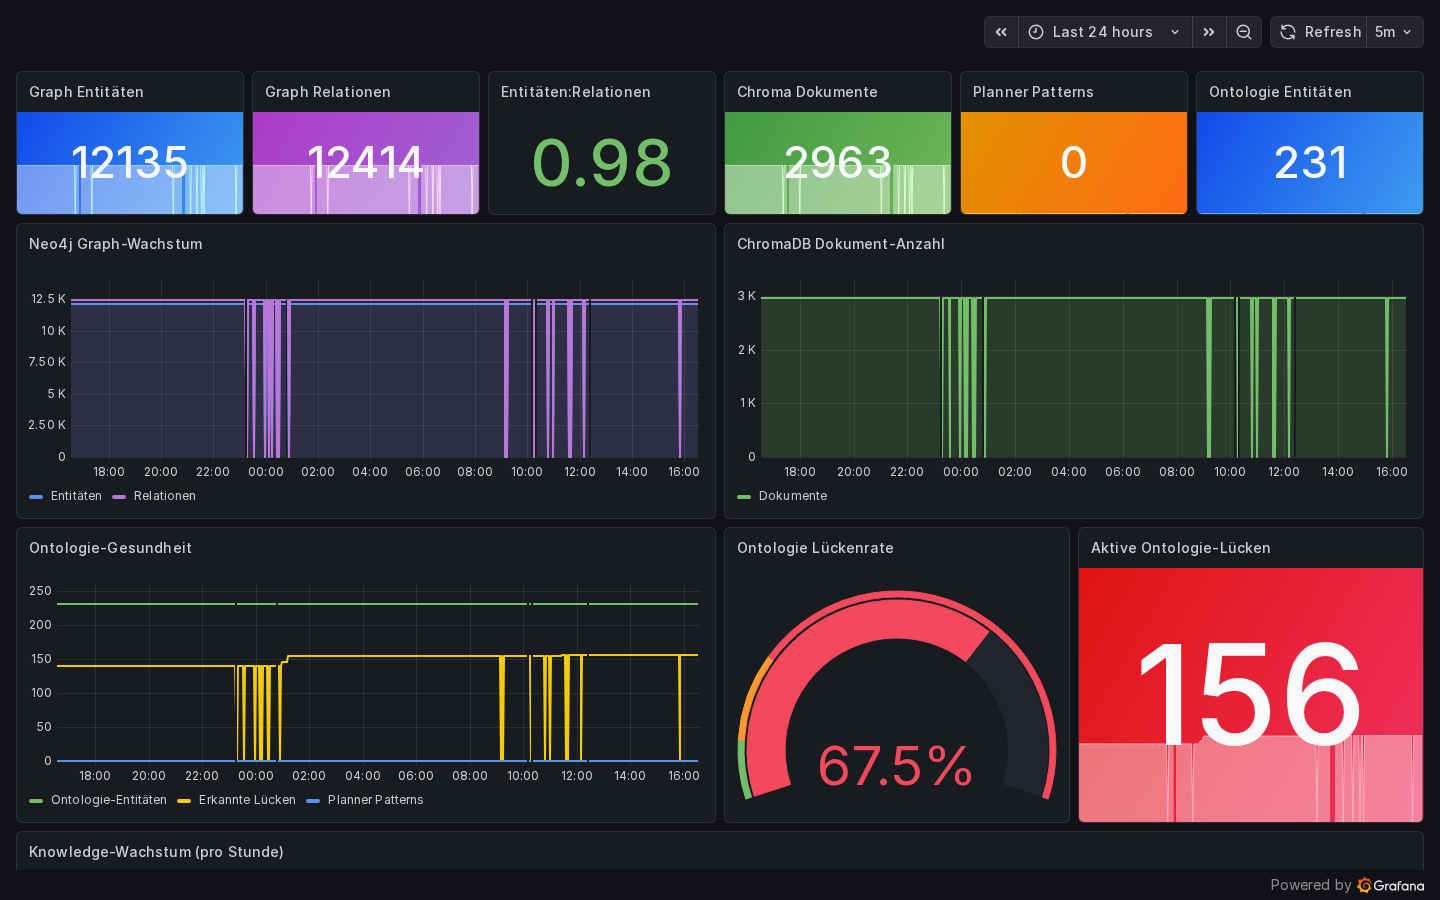
Knowledge Base Health
Neo4j entity count, relation count, gap-queue depth, and per-template healing throughput.
GPU & Inference Nodes
Real-time GPU utilisation, VRAM occupancy, and inference throughput across all heterogeneous nodes. Captured in kiosk mode.

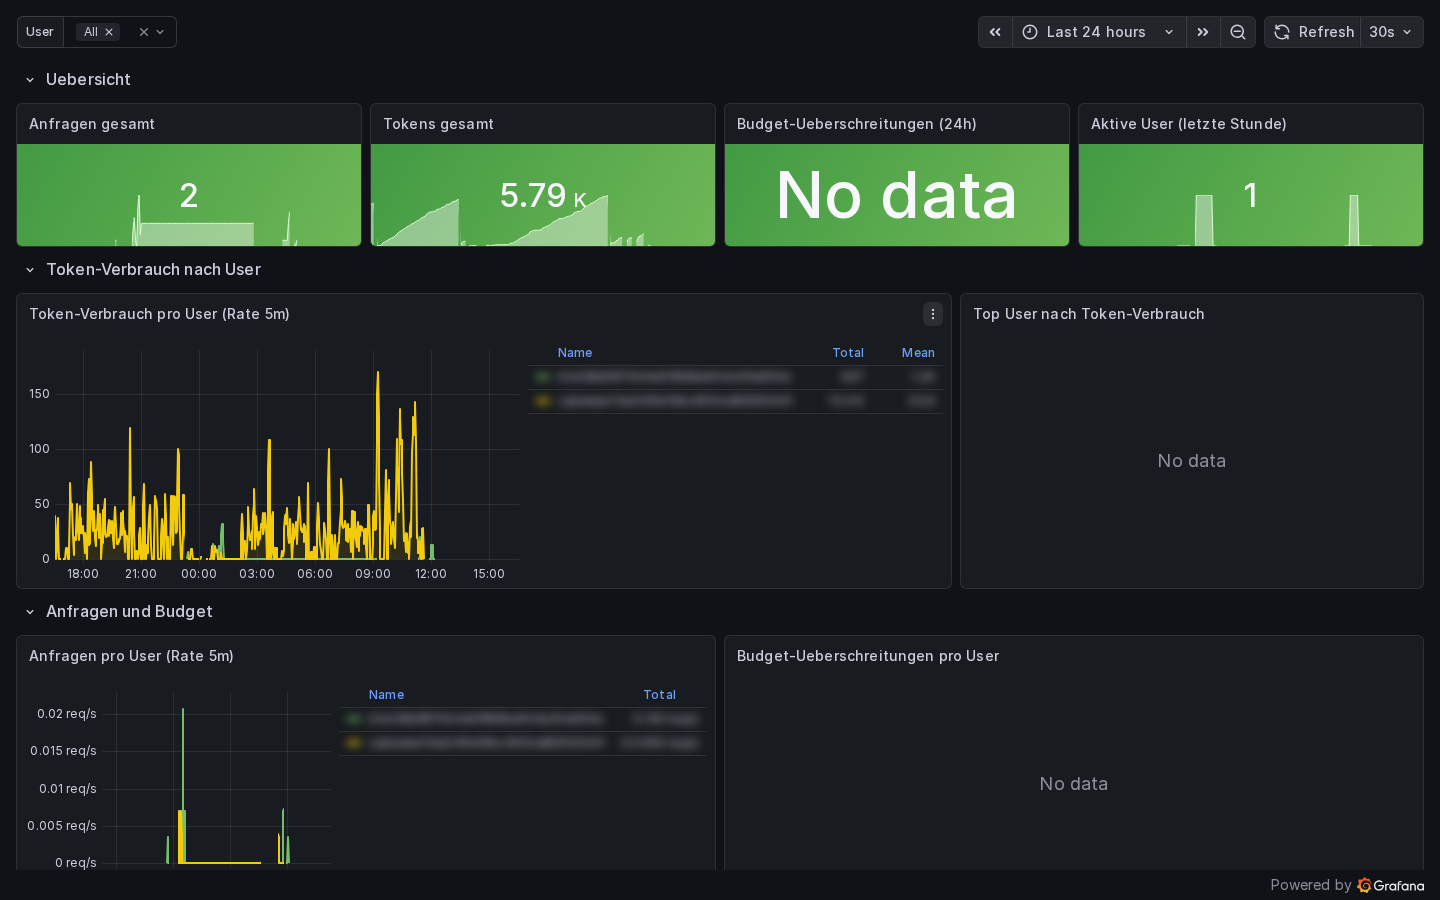
User Metrics
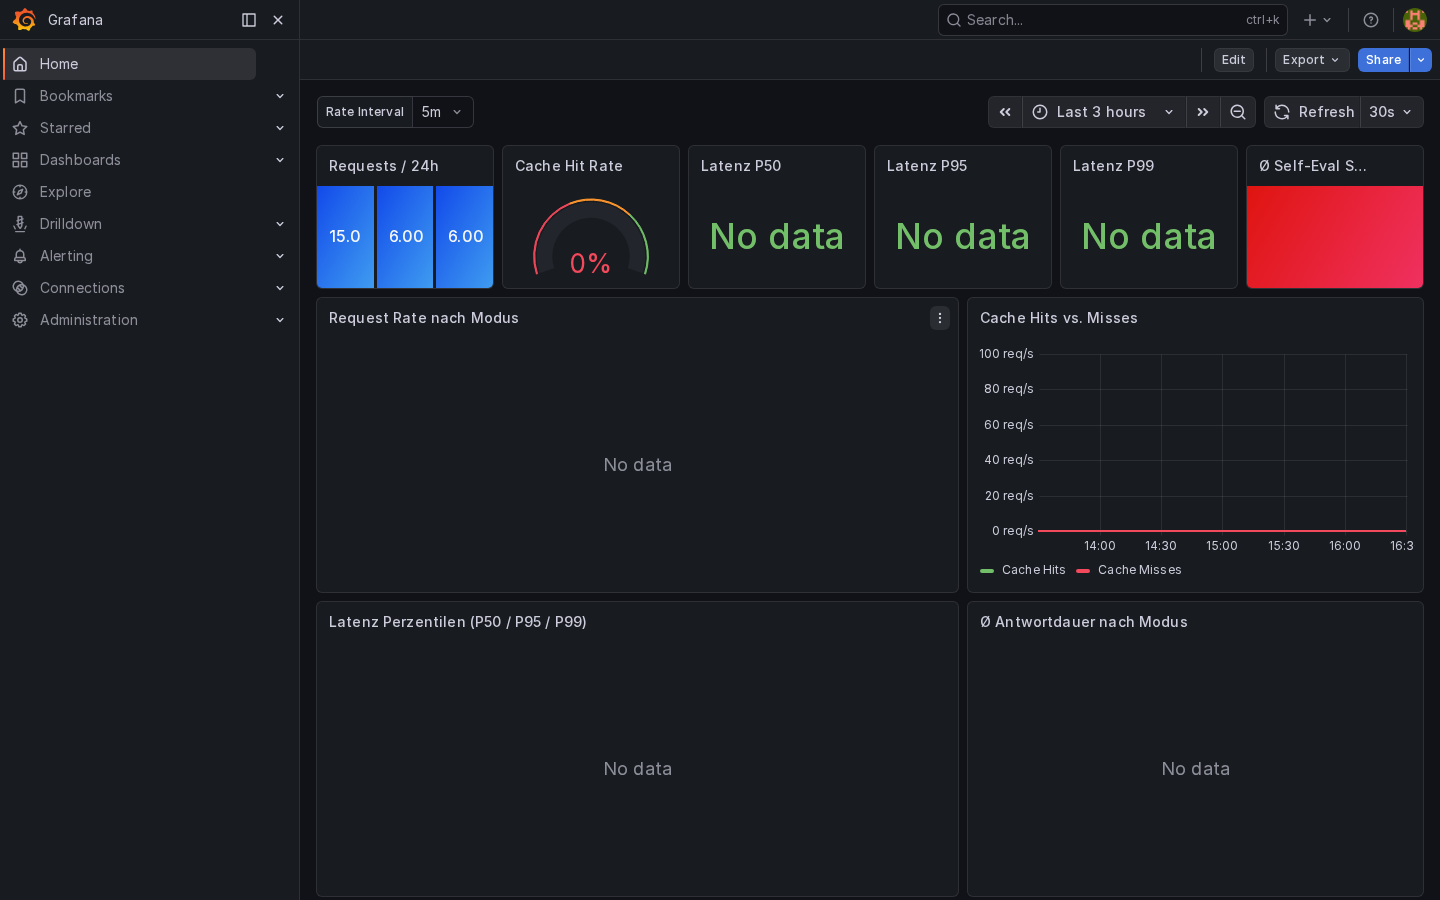
Grafana Home
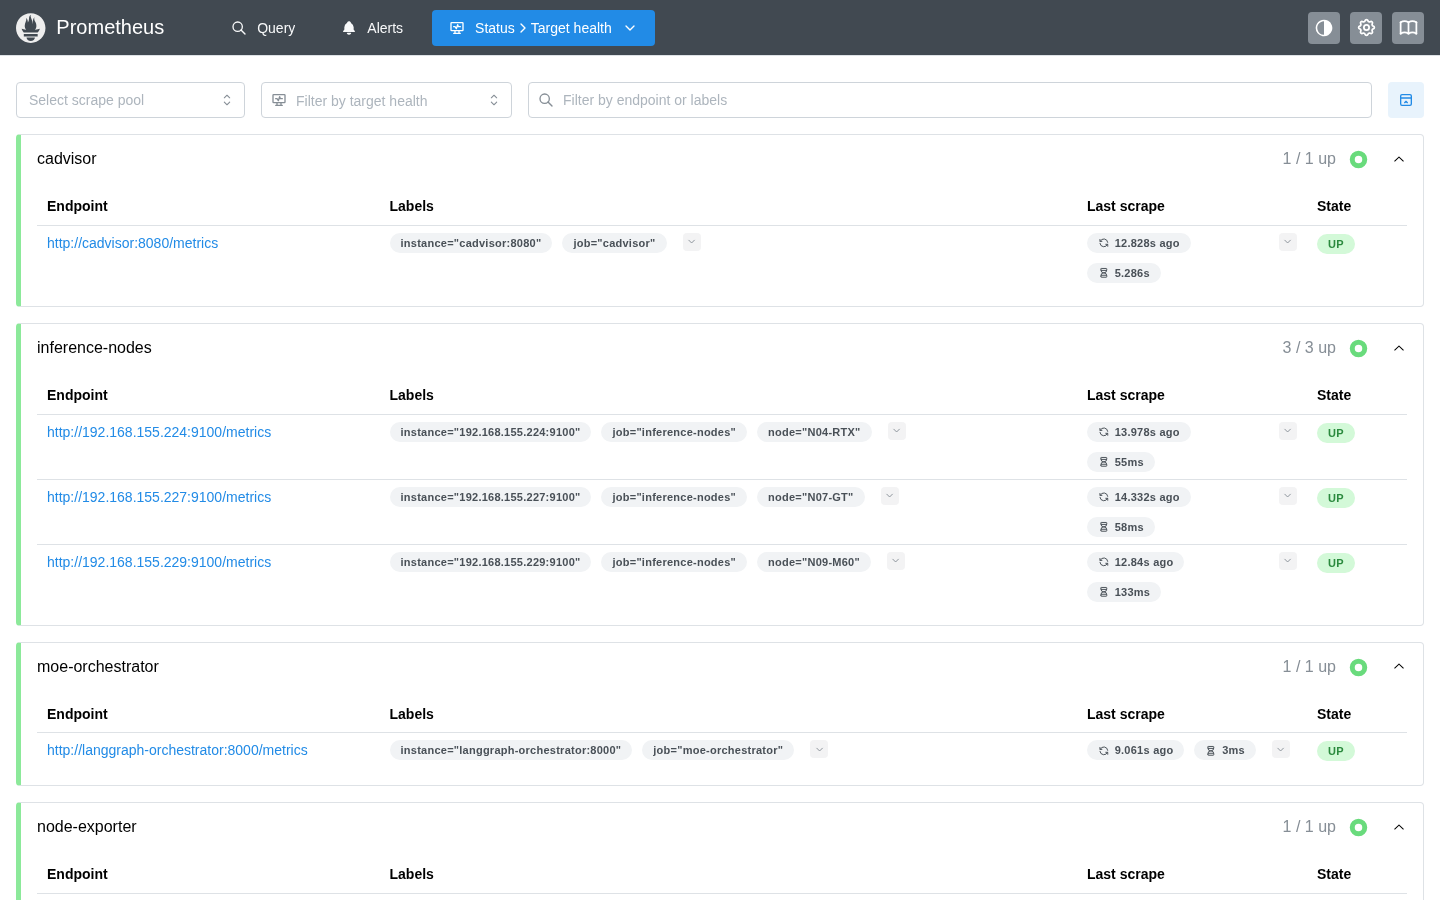
Prometheus
Scrape Targets
All configured scrape jobs with health status (UP/DOWN) and last-scrape timing.
Dozzle — Log Viewer
Container log aggregation across all MoE Sovereign services, accessible without SSH access.

Neo4j — Knowledge Graph
Neo4j Browser showing entity subgraph: nodes (Framework, Concept, Protocol, Tool) and typed relations (IS_A, USES, IMPLEMENTS, PART_OF).
Optional component
Neo4j is optional since v2026.05. Skip it during install.sh for lightweight VMs
that only need expert templates and CC profiles.

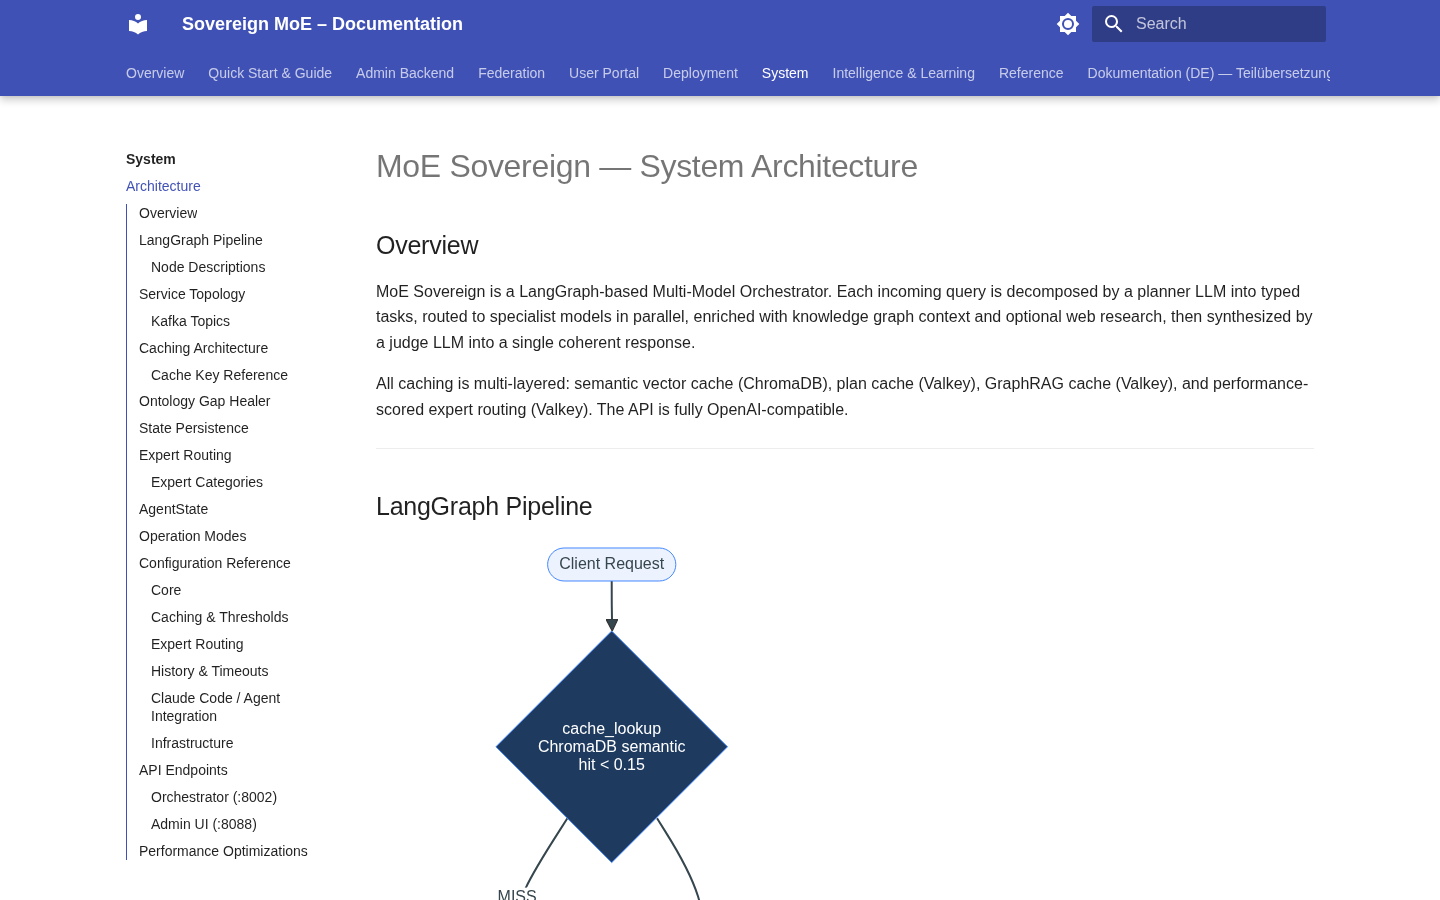
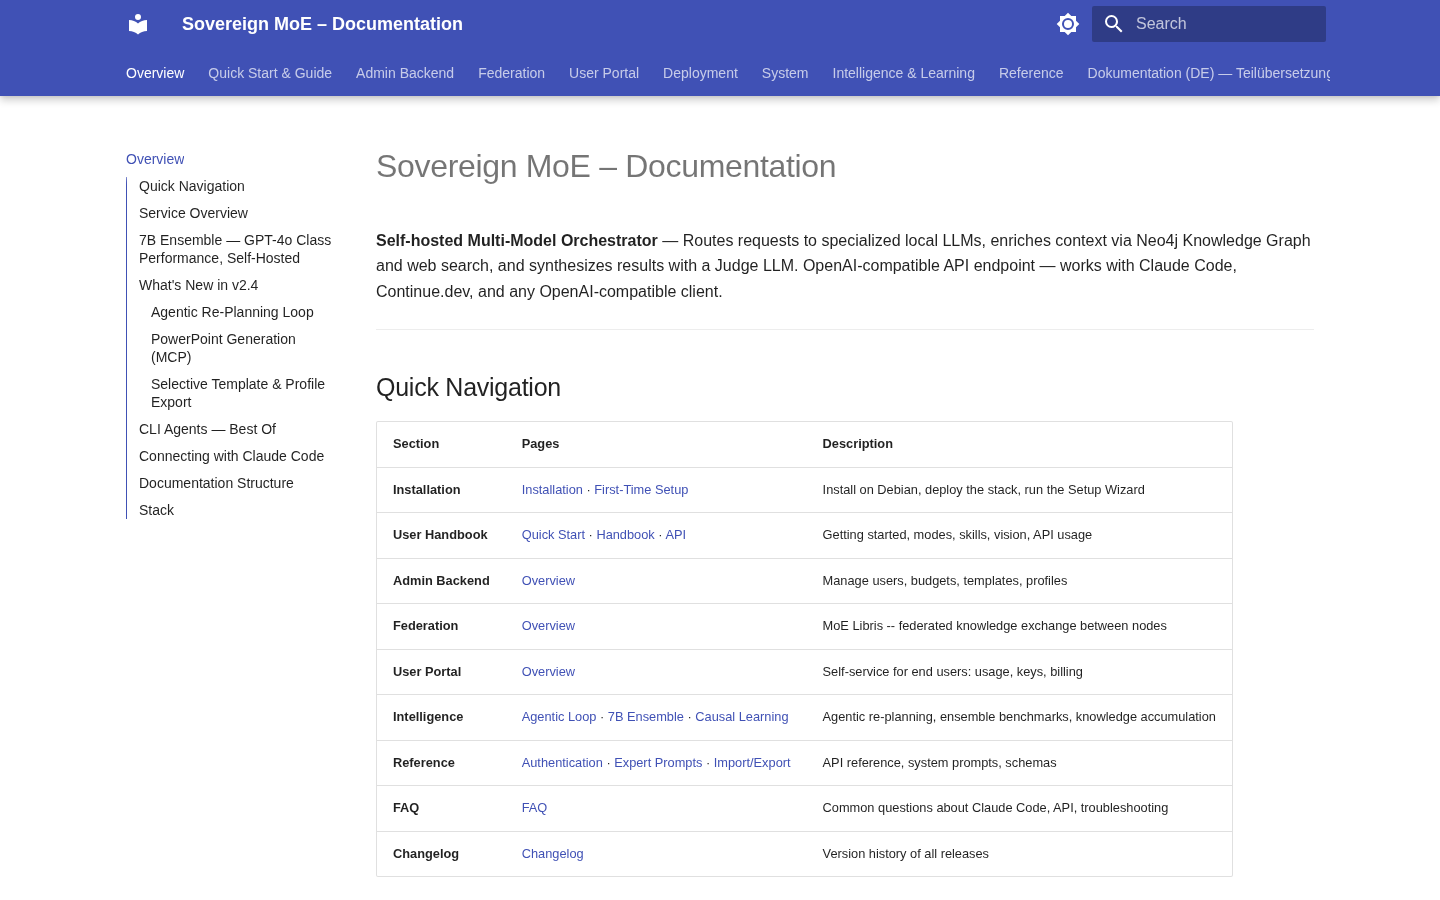
MkDocs Documentation
Home
Architecture Page